GO BACK
Data Visualization
University Project
2018
Bogotá D.C. Colombia
ABOUT
Infographic
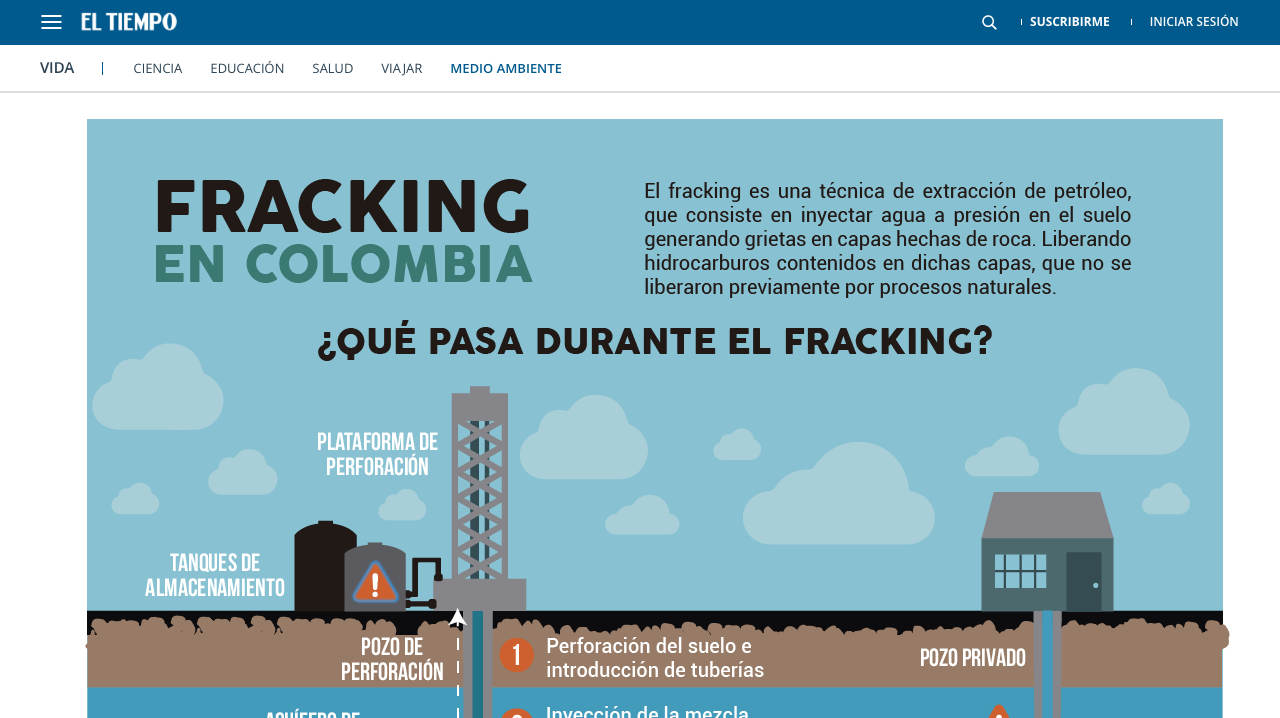
Infographics on a relevant topic in Colombia. In this case, we chose the topic of fracking in Colombia and how it affects our country if it is implemented.
To see the project click here: Infographic
Map
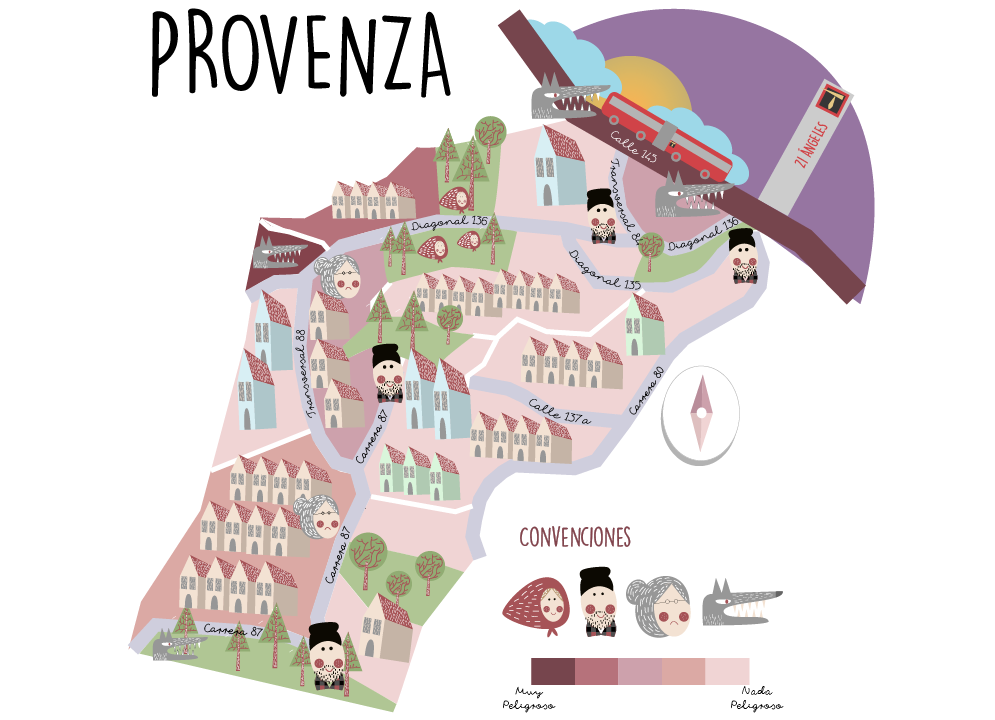
A neighborhood was chosen in Bogota, its architectural, spatial, functional and identity characteristics were analyzed, identifying characteristics of the place and the needs of its inhabitants. The map shows a neighborhood that changes during the day showing the insecure zones and characteristic areas of the place.
To see the project click here: Map
SKILLS
Programming
Design
Personal